01 - Workflows and Benchmarks
Similar to GitHub Actions workflows, a Daisytuner workflow defines a benchmarking job that triggers on specific events, such as a push to a branch or the creation of a pull request. Jobs run on our computing cluster, daisyfield, with results available via our web dashboard and integrations into GitHub or GitLab such as pull request comments.
Defining a Workflow
A workflow is defined in a YAML file, which must reside within a daisy/ directory at the root of your repository. The configuration file consists of three primary sections:
- on: Specifies trigger conditions, similar to GitHub Actions syntax.
- parameters: Defines job-specific execution settings, such as target partitions and timeouts.
- steps: Contains two main subsections:
- build: Installs dependencies and compiles applications.
- run: Specifies the benchmarks to execute and their respective commands and metrics.
Benchmarks are at the core of the workflow. They define the performance tests to be executed and can be anything, such as C applications or Python scripts. Benchmarks should thereby be written to cover critical functionality of your application, just like unit tests.
Here’s an example workflow that benchmarks the runtime, number of floating point operations and other metrics for a benchmark named matmul:
on:  push:    branches:      - main  pull_request:    types: [opened, reopened, synchronize, ready_for_review]
parameters:  partitions:    - zinnia    - bellis5  timeout: 60
steps:  build: |    # Install dependencies    sudo apt-get update    sudo apt-get install -y ...
    # Compile the benchmarks    docc -O2 matmul.c -o matmul.out    ...
  run:    matmul:      command: ./matmul.out      measurements: 3      threshold: 0.025      profiler: perf      loops: true      kernels: false      metrics:        - flop_dp        - flop_sp        - memory_volume        - memory_bandwidth
The on Section
This section defines the conditions under which the workflow is triggered. It follows syntax similar to GitHub Actions. You can find a detailed description of all available trigger options in our Workflow Reference.
The parameters Section
Parameters allow you to customize how your jobs execute on our cluster:
partitions: Lists cluster partitions where the benchmarks will run. Available partitions and their specifications are detailed in the Partitions Reference.timeout: Maximum duration (in minutes) allowed for benchmark execution before being terminated.
The steps Section
build Subsection
This subsection is executed first and prepares the environment for your benchmarks. Common tasks include installing dependencies, setting up the environment, and compiling your benchmarks.
Example:
sudo apt-get updatesudo apt-get install -y <dependencies>docc -O2 matmul.c -o matmul.outrun Subsection
Here you define your benchmarks, specifying:
command: The executable command to run the benchmark.measurements: The number of repeated runs to ensure result reliability.threshold: An optional absolute threshold for the runtime of the benchmark in seconds. Exceeding this threshold fails the job.profiler: Profiling tool used to collect to performance metrics.loops: Enable the collection of PAPI profiling data for loops. Constructs precise roofline models. See Automatic Loop-Level Analysis with DOCC. Only available for compilation with the DOCC.kernels: Enable the collection of NCU profiling data for individual computing kernels. Only available on NVIDIA GPUs.metrics: Performance metrics to collect during the run, such as energy usage, floating-point operations (flop_dp), and memory utilization (memory_volume).
Ready to Measure
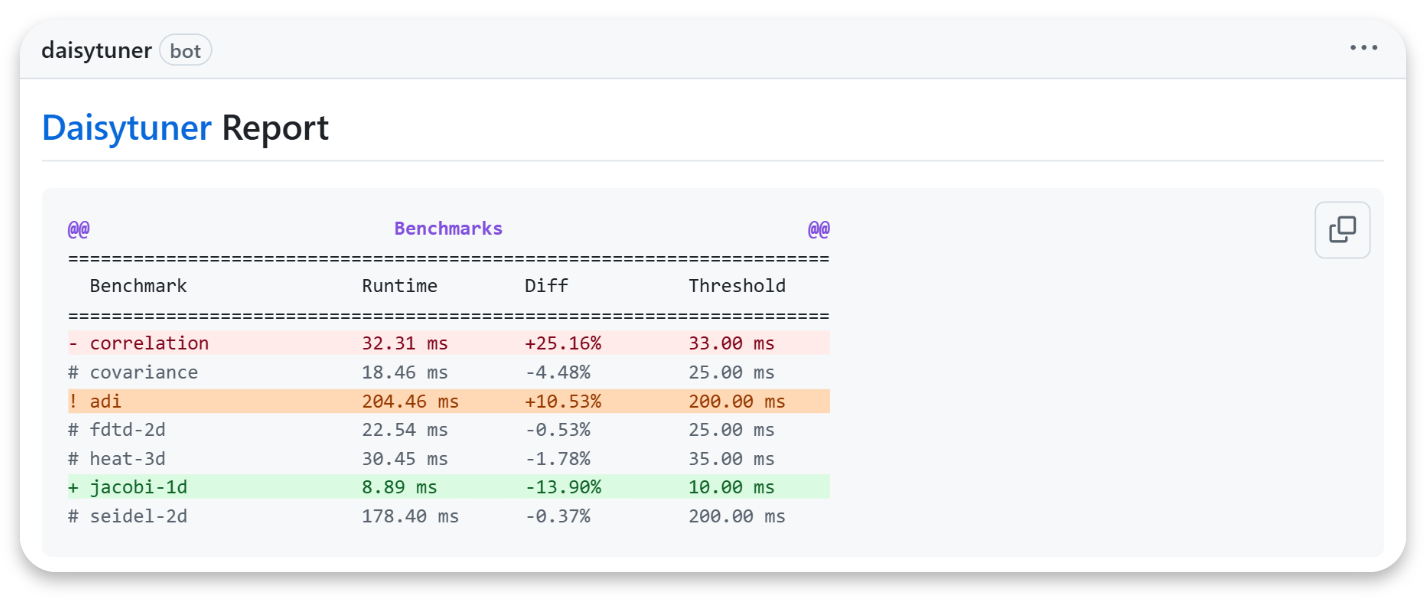
With the definition of a workflow file, you’ve successfully added a fully functional Continuous Benchmarking (CB) pipeline to your repository. You can now add benchmarks or define additional workflows within your repository. Our app automatically adds status checks to your commits and comments to your pull requests, making it easy to track and optimize performance.
The next sections dive deeper into features such as performance metrics, profiling, and bottleneck analysis.