02 - Measuring Performance
Measuring the runtime of benchmarks is often sufficient to identify performance regressions. However, runtime alone is an unbounded metric—aside from the trivial lower bound of zero—providing little insight into actual bottlenecks. To address this, the benchmarking jobs collect a comprehensive set of performance properties, offering deep insights into your application’s performance.
Performance Metrics: Understanding Hardware Effects
Modern processors include dedicated hardware features called performance counters, which collect detailed statistical data about application execution. Performance counters capture low-level metrics such as:
- The volume of memory transfers
- The number of executed floating-point operations
- The number of predicted and mispredicted branching instructions
From these raw statistics, Daisytuner computes higher-level performance metrics that reflect hardware utilization. Many of these metrics are inherently bounded, making them effective indicators of the hardware utilization. Examples include:
- Cache hit-to-miss ratios
- Branch misprediction rates
- Vectorization rates of floating-point operations
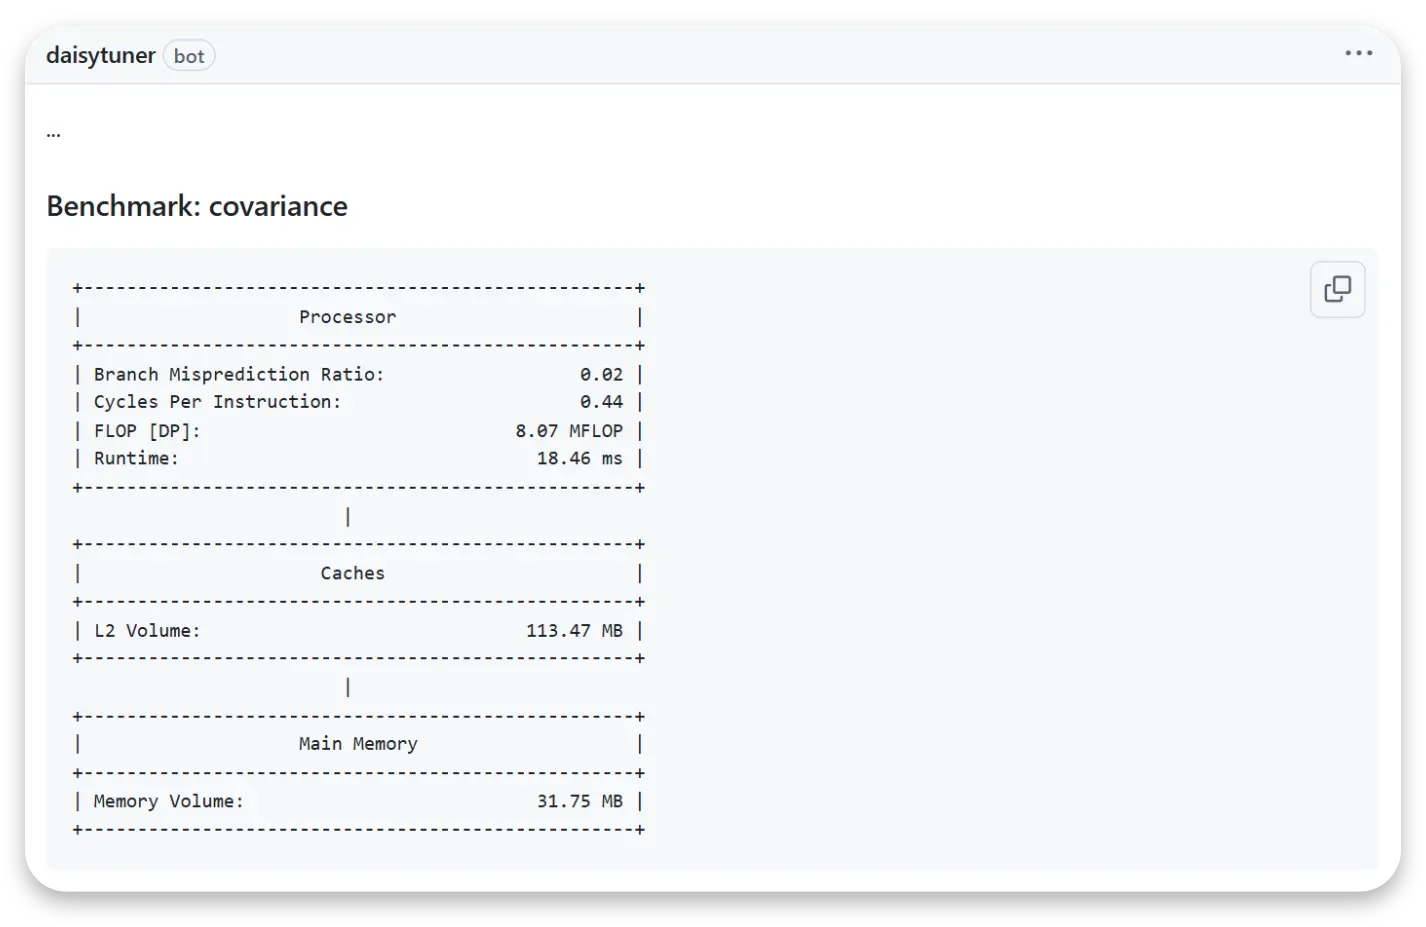
Collected metrics are available in our web dashboard and are also provided automatically in pull request comments, visually summarized in a convenient hardware diagram.
How to Use
Include desired metrics using the metrics parameter in your benchmark definition:
run: benchmark_1: command: ./a.out measurements: 5 profiler: perf metrics: - flop_dp - memory_volume - br_misp_ratioYou can find a comprehensive list of available metrics for each computing partition in the Partitions Reference.