03 - Adding a Profiler
In this tutorial, we will extend the previous benchmarking pipeline to obtain performance metrics.
Step 1: Profiling with py-spy
Running a profiler is as simple as adding a new parameter in .daisy/benchmark-python.yml. The workflows support various profilers. For the scope of the tutorial, we choose py-spy.
on:  push:    branches:      - main  pull_request:    types: [opened, reopened, synchronize, ready_for_review]
parameters:  timeout: 30  partitions:    - bellis5
steps:  build: |    sudo apt-get install -y python3-numpy
  run:    matmul:      command: python3 matmul.py      measurements: 1      profiler: py-spy
This workflow:
- Triggers automatically upon every push to the main branch.
- Runs your benchmark on the bellis5 partition of our cluster.
- Profiles the python code using py-spy
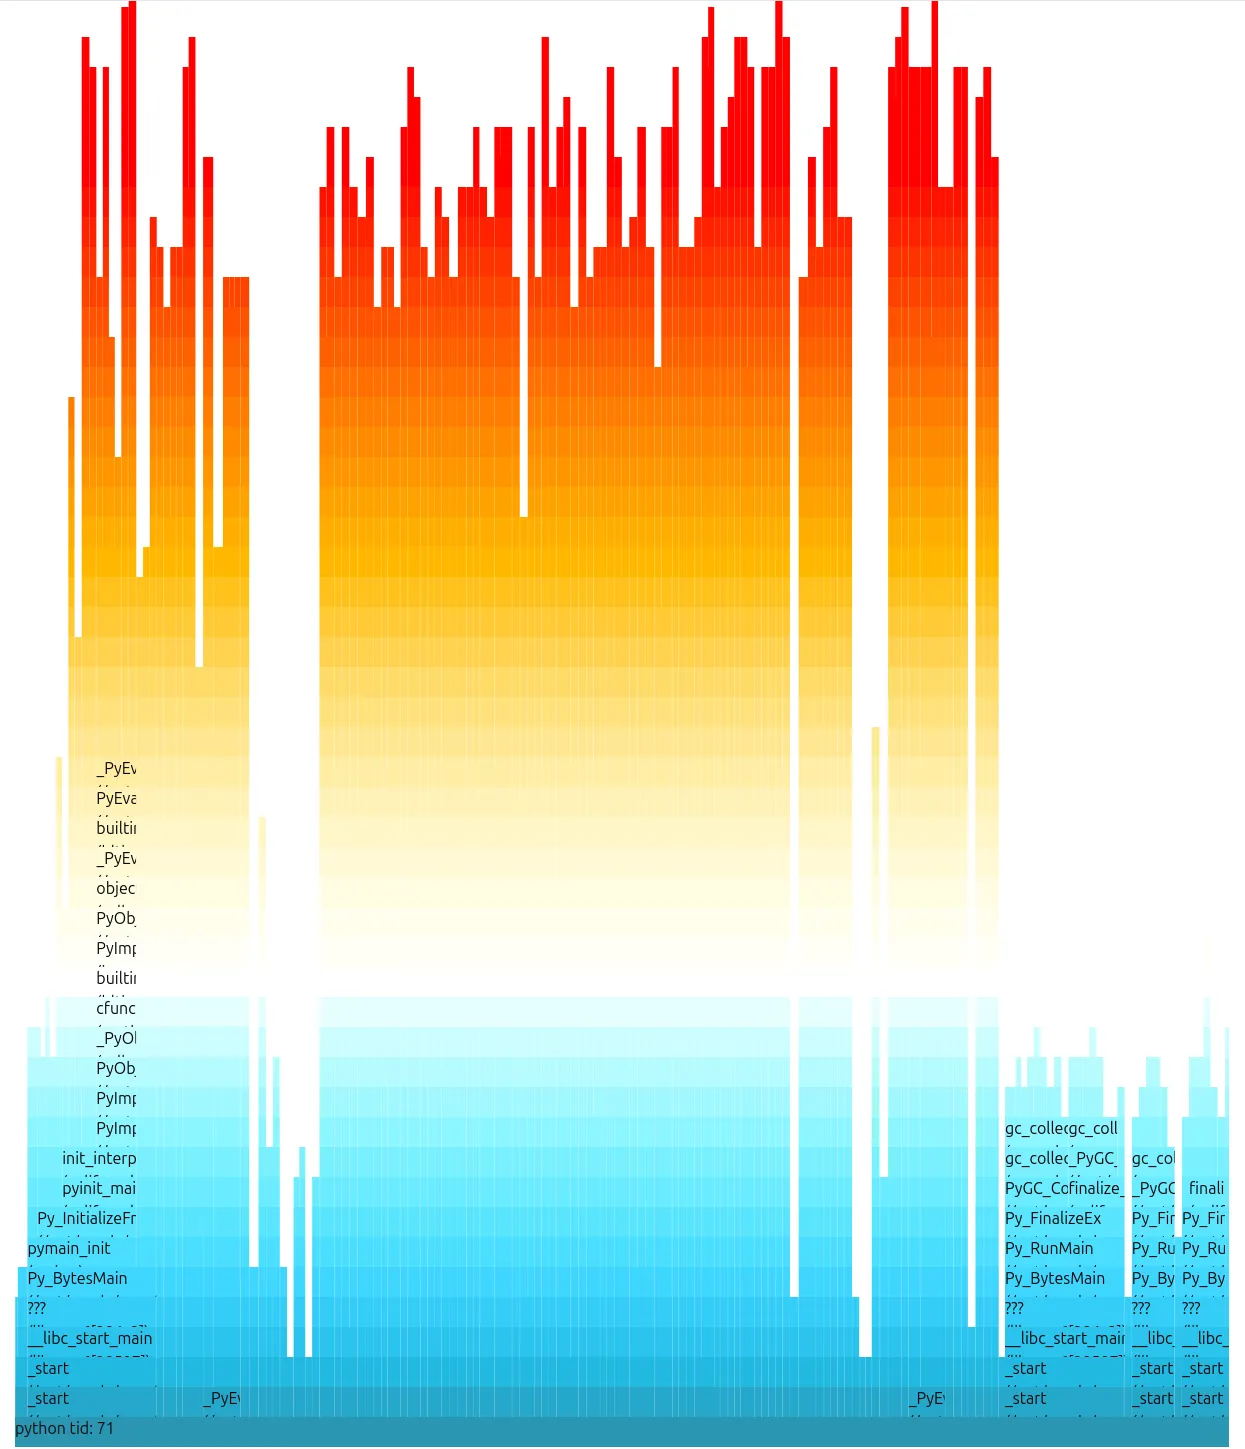
After pushing your changes, Daisytuner will automatically execute the updated workflow. Our dashboard previews the resulting Flame Graph for multiple threads. For a more detailed view, you can also export the speedscope data and use a visualizer of your choice!
 ,
,
Step 2: Hardware Utilization
The metrics parameter allows you to easily obtain performance metrics that reflect the hardware utilization of your benchmark.
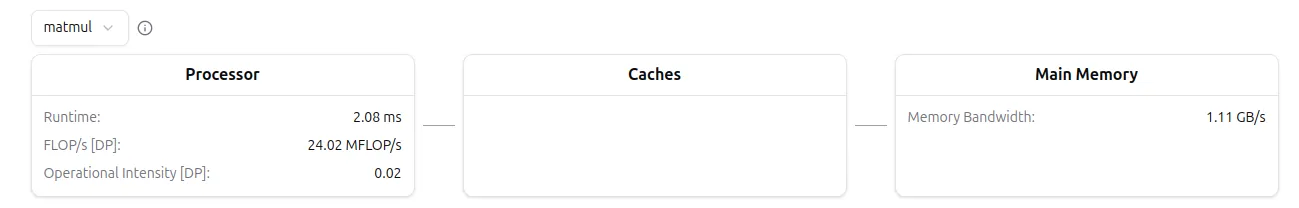
run: matmul: command: python3 matmul.py measurements: 1 profiler: py-spy metrics: - flops_dp - memory_bandwidthThe Dashboard shows measurements for the requested metrics on top of the page:
Happy benchmarking! 🎉
Extension: Profiling Python with Perf
Since Python 3.12, Python supports profiling wiht perf natively (documentation). Adapt your workflow accordingly.
run: matmul: command: python3 matmul.py measurements: 1 profiler: perf metrics: - flops_dp - memory_bandwidth